Wealth Inequality
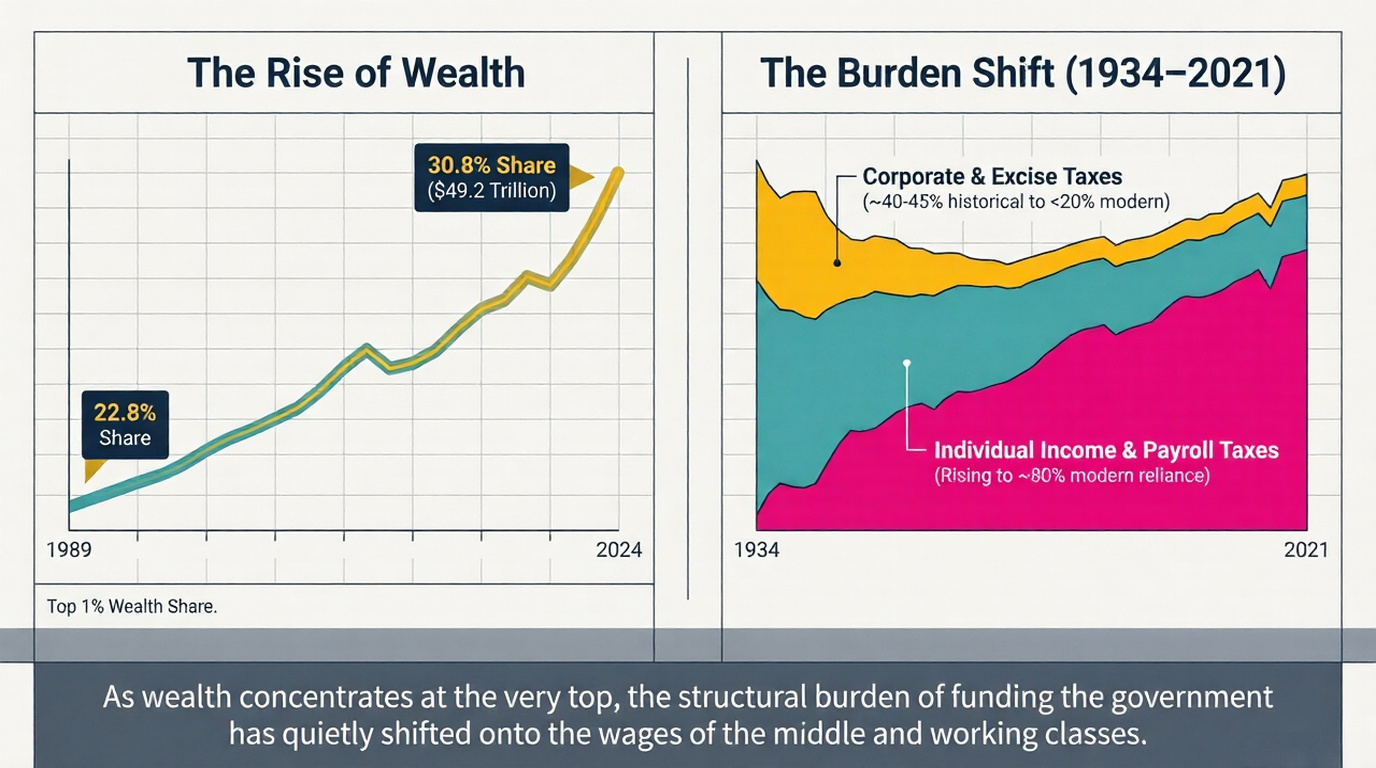
The concentration of capital income makes this proposal especially consequential.
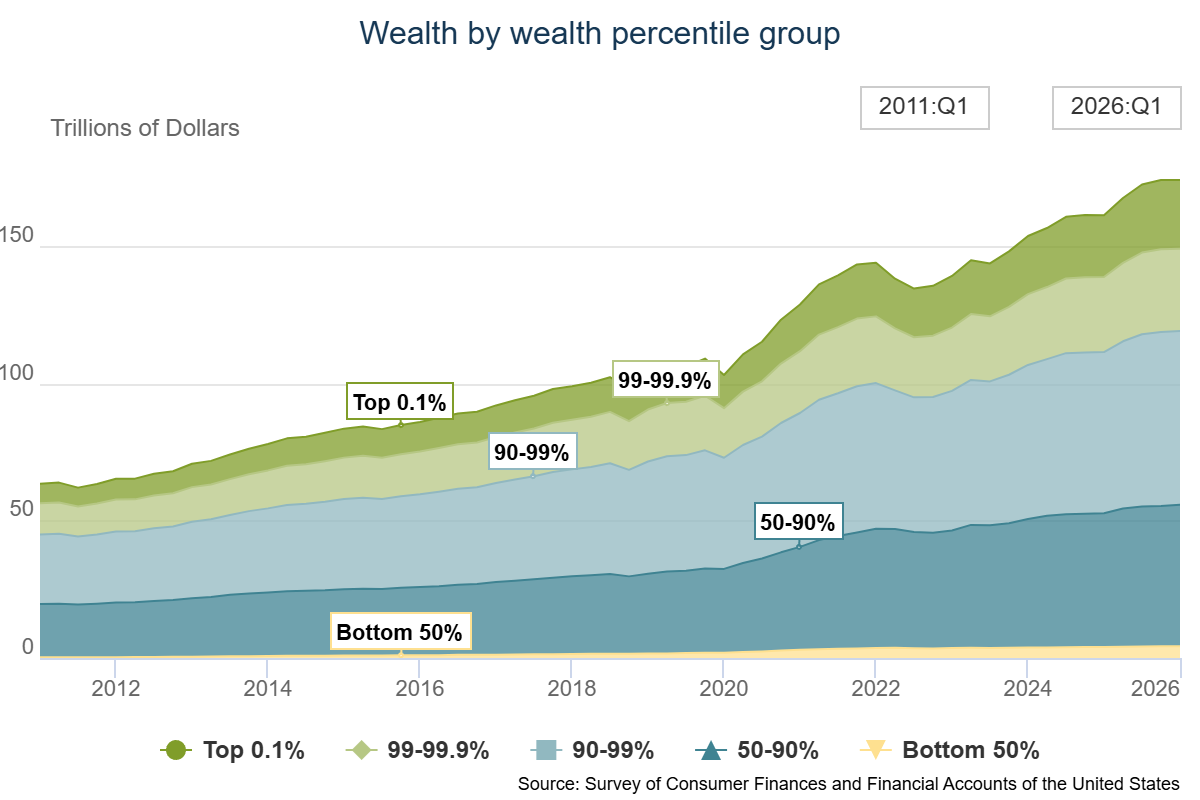
While the top 1% has expanded its grip on wealth, the bottom 50% (1st to 50th wealth percentiles) has seen its share decline. The bottom 50% holds just 2.8% of total U.S. net worth, reflecting a widening wealth inequality.
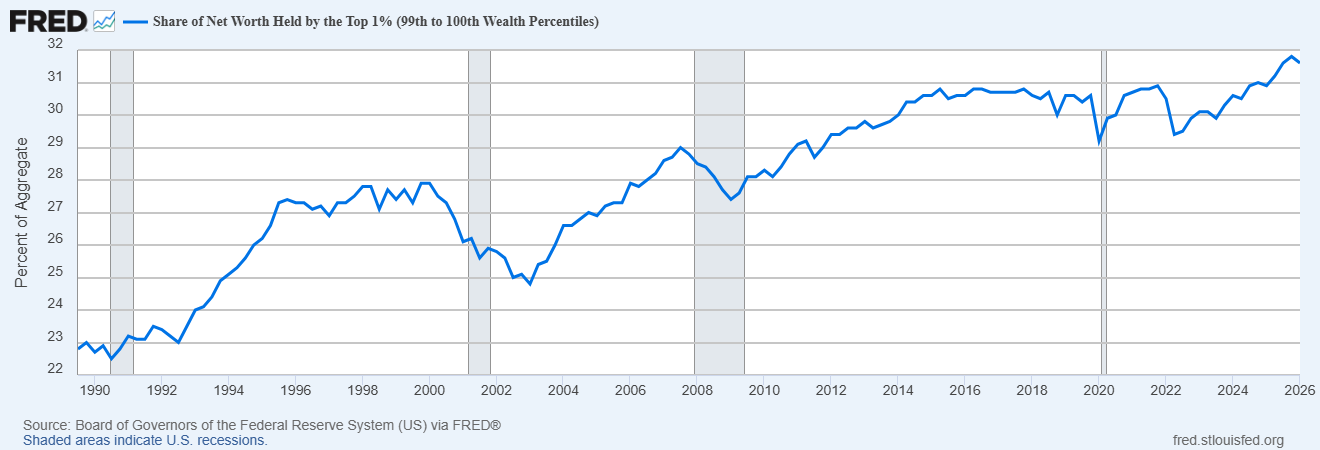
Current data from the Research Department at the Federal Reserve Bank of St. Louis, or FRED show a huge spike in wealth disparity.
Equitable Growth (OECD) found that the top 1 percent received 45.3 percent of capital gains from 2002–2021, while the top 10 percent received 75.7 percent; it estimated an effective tax rate of 5.2 percent on real capital gains after accounting for realization and other features. At the same time, capital income gained more favorable treatment relative to labor income. The Center for Public Integrity posts that in 1981 the ERTA gave the wealthiest Americans who received dividend and interest payments a hefty yearly tax cut of $6.7 billion, the equivalent of $21 billion today. Out of 95 million taxpayers who filed that year, this bounty went to just 82,000: the richest sliver of the top 1%.
The contemporary “K‑shaped” economy starkly illustrates a legal and structural divergence between the asset‑owning elite and ordinary workers. While median U.S. household wealth hovers around $192,000 and median individual income is roughly $45,000–$55,000, the top 1% typically hold over $10 million in wealth and many Fortune 500 CEOs earn 200–350 times the pay of their median employees—e.g., a CEO at $15–20 million annually versus a worker at $50,000–$70,000. This upper “arm” of the “K” grows through legally sanctioned mechanisms that shield income and wealth — trusts, estates, complex corporate structures, and preferentially taxed returns on stocks and bonds.
The US Census Bureau reported that in 2022, the median U.S. family had net worth of approximately $192,900. In 2024, median annual earnings were about $51,370 among U.S. workers with earnings. At large publicly traded companies, the Federal Reserve reports that CEO compensation was vastly higher: the Economic Policy Institute estimates that CEOs at the 350 largest U.S. firms received average realized compensation of $22.98 million in 2024—about 281 times the compensation of a typical worker. This upper “arm” of the “K” grows through legally sanctioned mechanisms that shield income and wealth — trusts, estates, complex corporate structures, and preferentially taxed returns on stocks and bonds.
- Capital-gains preference
- Investment gains can face lower rates than top wages
- Step-up in basis
- Untaxed appreciation may escape capital-gains tax at death
- Deferral
- Unrealized gains can grow for years without income tax
- Estate-tax exemptions and planning
- Large transfers can be reduced through exemptions, trusts, valuation techniques, and other planning
- Corporate and pass-through structures
- Owners may choose timing, character, and location of income more easily than wage earners
- Offshore structures
- Cross-border capital mobility and tax havens make enforcement more difficult
